Compare Validation Curves
Assumptions
- Predefined Dataset Split:
- The dataset has already been split into train and test sets, and the focus is on the train set.
- Model and Metric Defined:
- A single model and performance metric (e.g., accuracy, F1 score, RMSE) are chosen for evaluation.
- Model Capacity Adjustable:
- The model allows for tuning of capacity parameters (e.g., tree depth for decision trees, k for k-nearest neighbors).
Procedure
-
Vary Model Capacity
- What to do: Adjust the model’s capacity parameter across a range of values (e.g., from underfitting to overfitting scenarios).
- Data Collection: For each configuration, record performance scores on both train and validation sets.
-
Evaluate Performance for Each Configuration
- What to do: Assess the model’s performance using the chosen metric for both train and validation sets after each capacity adjustment.
- Optional: If using k-fold cross-validation, calculate the distribution of performance metrics for train and validation folds for each capacity configuration.
-
Plot Validation Curve
- What to do: Generate a line plot with model capacity on the x-axis and performance scores on the y-axis:
- Include separate lines for train and validation scores.
- If using k-fold CV, display performance distribution as error bands or points for each fold.
- What to do: Generate a line plot with model capacity on the x-axis and performance scores on the y-axis:
-
Analyze Curve Shape
- What to do: Look for specific patterns in the train and validation score curves:
- Rapid divergence of train and validation scores at higher capacities suggests overfitting.
- Low scores for both train and validation sets across all capacities indicate underfitting.
- What to do: Look for specific patterns in the train and validation score curves:
-
Report Observations
- What to do: Summarize the results, focusing on:
- Signs of overfitting or underfitting.
- The capacity range where the model achieves optimal balance between train and validation performance.
- What to do: Summarize the results, focusing on:
Interpretation
Outcome
- Results Provided:
- A validation curve plot showing train vs. validation performance scores across model capacity values.
- Observations about the relationship between capacity, train scores, and validation scores.
Healthy/Problematic
-
Healthy Validation Curve:
- Train and validation scores converge at higher performance levels for a specific capacity range, indicating an optimal balance.
- Minimal divergence between train and validation scores suggests the model generalizes well.
-
Problematic Validation Curve:
- Overfitting: Train scores are high while validation scores drop significantly at higher capacities.
- Underfitting: Both train and validation scores remain low regardless of capacity.
Limitations
- Model-Dependent:
- Results are specific to the chosen model and its capacity parameter; other models may require separate validation.
- Metric Sensitivity:
- The interpretation depends on the chosen metric; different metrics may suggest varying optimal capacities.
- Dataset Variability:
- Imbalanced or insufficient data can lead to misleading validation curves, making it hard to distinguish between underfitting and overfitting.
Code Example
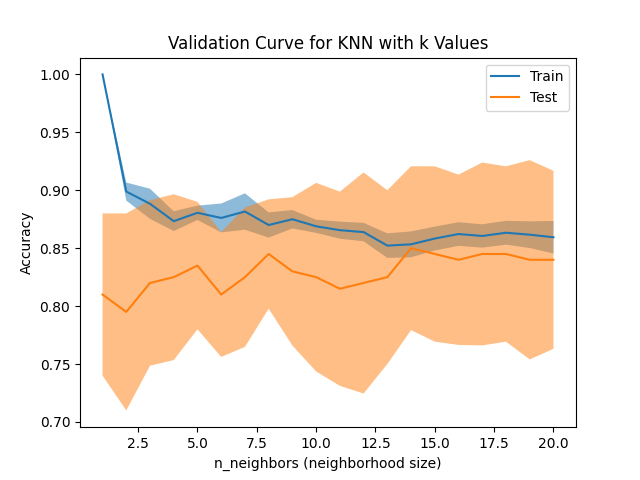
This example performs k-fold cross-validation for a classification task, gathers train and test fold scores, and creates a validation curve to visualize the train vs. test performance across folds.
import matplotlib.pyplot as plt
import numpy as np
from sklearn.datasets import make_classification
from sklearn.neighbors import KNeighborsClassifier
from sklearn.model_selection import ValidationCurveDisplay

# Generate synthetic classification data
X, y = make_classification(n_samples=200, n_features=5, n_informative=2, random_state=42)

disp = ValidationCurveDisplay.from_estimator(
    KNeighborsClassifier(),
    X,
    y,
    param_name="n_neighbors",
    param_range=range(1,21,1),
    cv=10,
    score_type="both",
    n_jobs=2,
    score_name="Accuracy",
)
disp.ax_.set_title("Validation Curve for KNN with k Values")
disp.ax_.set_xlabel(r"n_neighbors (neighborhood size)")
plt.show()
Example Output

Key Features
- Uses
ValidationCurveDisplay: Uses the built-in class that automatically calculates the validation curves for a given model and model capacity parameter. - K-Fold Cross-Validation: Automatically performs k-fold cross-validation to gather train and test accuracy for each fold.
- Validation Curve Plot: Visualizes train and test performance for all folds, allowing for easy identification of overfitting or underfitting patterns.
- Classification-Specific: Tailored to classification tasks and includes accuracy as the default metric.
- Mean Performance Visualization: Adds mean accuracy as a visual reference to highlight overall model performance trends.
- Reusable Functionality: Works with any classification model and metric from the sklearn ecosystem.